
Beyond Vanity: The Social Media Performance Metrics That Matter
Why Most Social Media Strategies Fail Without the Right Metrics
Social media performance metrics are the data points that tell you whether your social media activity is actually driving business results — or just burning time and budget.
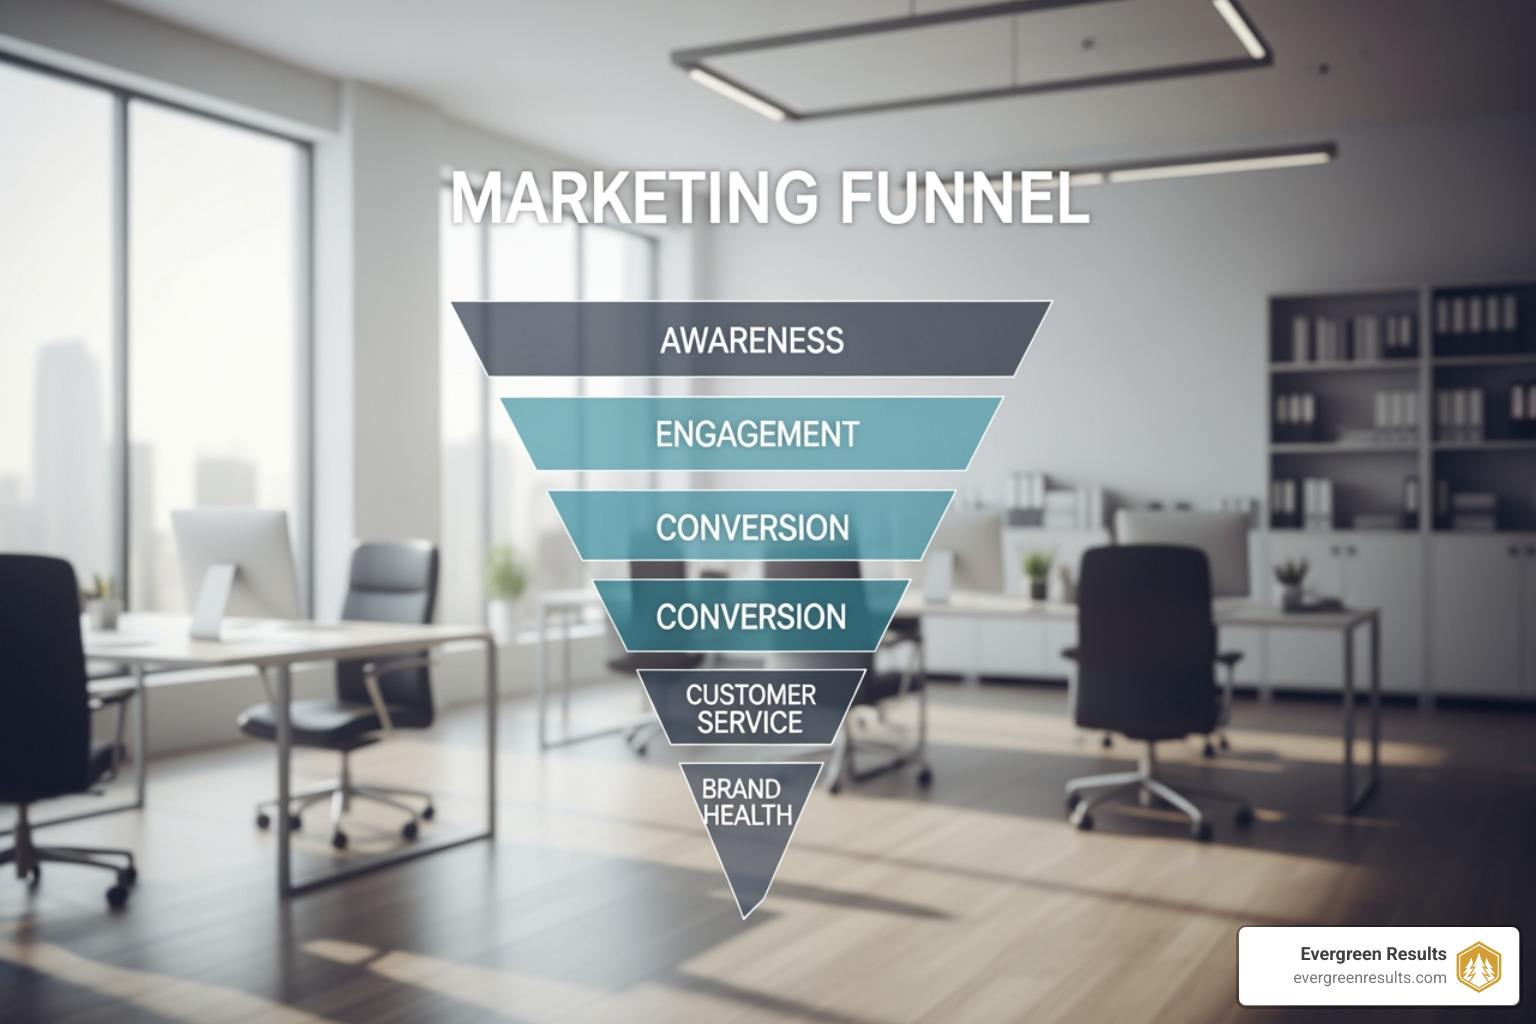
Here’s a quick breakdown of the core metric categories you need to know:
| Category | What It Measures | Key Metrics |
|---|---|---|
| Awareness | Visibility and reach | Impressions, Reach, Share of Voice |
| Engagement | Audience connection | Engagement Rate, Comments, Shares |
| Conversion | Business outcomes | CTR, CPC, ROAS, Conversion Rate |
| Customer Service | Support quality | Response Time, CSAT, NPS |
| Brand Health | Perception and reputation | Sentiment, Brand Mentions |
Here’s the uncomfortable truth: 65% of marketing leaders say they struggle to prove that social media supports real business goals. That’s not a content problem. It’s a measurement problem.
Most brands track what’s easy — likes, follower counts, impressions. These numbers feel good when they go up. But they rarely connect to revenue, customer growth, or brand equity.
The metrics that actually matter are the ones tied to a specific goal. Awareness. Engagement. Conversions. Customer satisfaction. When you track the right ones, social media stops being a cost center and starts being a growth engine.
I’m Adam Bocik, founder of Evergreen Results, and I’ve spent years helping active lifestyle brands cut through the noise by focusing on the social media performance metrics that drive real, sustainable growth. In this guide, I’ll walk you through exactly which metrics to track, how to calculate them, and how to use them to make smarter decisions.
Quick look at Social media performance metrics:
Defining Social Media Performance Metrics and Their Business Value
When we talk about social media performance metrics, we are looking at the numbers and percentages that showcase how well your activities are performing across various platforms. These metrics translate raw user behavior into business intelligence. Without them, you are essentially driving a car with a blacked-out windshield — you might be moving, but you have no idea where you are going.
For businesses in Denver, Boulder, and throughout Colorado, understanding these metrics is the difference between a “viral” post that does nothing and a steady campaign that builds a community. It is a common industry observation that most metrics go “flatline” because they don’t connect and align to what actually matters to the business. If your goal is to sell more outdoor gear or craft beer, a million impressions on a meme won’t help if none of those people live in your service area or share your brand’s values.
Strategic alignment is key. You need to choose metrics that match your specific stage in the marketing funnel:
- Top of Funnel (Awareness): Focus on reach and impressions.
- Middle of Funnel (Consideration): Focus on engagement and brand mentions.
- Bottom of Funnel (Conversion): Focus on CTR, CPC, and ROI.
By focusing on What is ROI in Social Media Marketing?, we can move away from “vanity” and toward “value.”
Common Mistakes in Selecting Social Media Performance Metrics
Even the most seasoned marketers in Aurora or Fort Collins can fall into measurement traps. Here are the most common blunders we see:
- Over-tracking: More data doesn’t always mean more clarity. Think of it like hot sauce or glitter on a Mother’s Day card — a little goes a long way, but too much just creates a mess.
- Ignoring Context: A spike in engagement might seem great until you realize it’s because of a PR crisis or a wave of negative comments.
- Misaligned KPIs: Tracking “likes” when your goal is “website sales” is a recipe for frustration.
- Lack of Benchmarks: If you don’t know that the median engagement rate for your industry is 3%, you won’t know if your 2% is a success or a failure.
- Focusing on Raw Numbers: Raw follower counts are less important than the Follower growth rate, which tells you if your audience is actually expanding over time.
Awareness and Brand Health: Measuring Visibility Beyond the Follower Count
Awareness metrics tell you how many people are seeing your brand and how they perceive it. While follower count is often called a “vanity metric,” it’s actually a decent health indicator — 70% of people who follow a brand on social media plan to purchase from them eventually.
However, we need to dig deeper:
- Reach vs. Impressions: Reach is the number of unique people who saw your post. Impressions are the total number of times your post was displayed. If one person in Colorado Springs sees your post three times, that’s a reach of 1 and 3 impressions. High impressions with low reach might mean your content is “sticky,” but it could also mean you are over-posting to the same small crowd.
- Share of Voice (SOV): This measures how much of the online conversation in your industry is about you versus your competitors. You calculate this by taking your brand mentions and dividing them by the total industry mentions.
- Brand Mentions: Tracking who is talking about you is vital. This includes direct @mentions and indirect mentions (plain text). For example, we might track #MetricStack X mentions to see real-time interaction. You can also use tools like Google Alerts to catch mentions that don’t tag you directly.
- Sentiment Analysis: It’s not just if people are talking, but how. Are they happy? Frustrated? Sentiment analysis uses AI to categorize mentions as positive, negative, or neutral, helping you protect your Social Media Brand Engagement.
Engagement Metrics: How to Measure Meaningful Audience Connection

Engagement is the “heartbeat” of social media. It tells you if people actually care about what you are saying. High engagement isn’t just a pat on the back; it also signals to social media algorithms that your content is high-quality, which pushes your reach even further.
The Engagement Rate Formula
There are many ways to calculate this, but the most common is Engagement Rate by Followers: (Total Engagements / Total Followers) x 100
If your Boulder-based bakery has 1,000 followers and your latest post gets 50 likes, 5 comments, and 5 shares, your engagement rate is 6%.
Why People Share
According to the 2024 Consumer Report on sharing motivations, people share content for three main reasons:
- Agreement (44%): They agree with the message.
- Information (29%): They found it helpful or educational.
- Inspiration (24%): It made them feel something positive.
When creating Engaging Social Media Content, aim for these three pillars.
- Amplification Rate: This is the ratio of shares per post to the number of overall followers. It tells you how willing your audience is to associate themselves with your brand by “amplifying” your message to their own circles.
- Virality Rate: This measures shares relative to impressions. It’s the ultimate metric for “shareability.” If a post gets 100 shares out of 1,000 impressions, that’s a 10% virality rate — which is like juicy corporate gossip spreading through an office.
Conversion and ROI: Proving the Bottom-Line Impact of Social Media
This is where the rubber meets the road. If you want to justify your marketing spend to leadership in Lakewood or Denver, you need to show the money.
- Click-Through Rate (CTR): This is the percentage of people who saw your post and clicked the link.
(Clicks / Impressions) x 100. Generally, a CTR above 5% is considered very good, while anything below 1% suggests your call-to-action (CTA) or creative needs work. - Cost Per Click (CPC): For paid campaigns, this is what you pay for every click. Facebook ads average $0.72 per click, which is often cheaper than LinkedIn or YouTube.
- Return on Ad Spend (ROAS): This tells you how much revenue you earned for every dollar spent on ads. If you spend $1,000 on Instagram ads for your Fort Collins brewery and make $5,000 in sales, your ROAS is 5:1.
- Conversion Rate: This tracks the percentage of users who take a specific action (like signing up for a newsletter) after clicking through from social media.
To track this accurately, we recommend Google Analytics for conversion tracking. By using UTM parameters to track social success, you can see exactly which post led to which sale. If you’re struggling with the math, check out our guide on How to Calculate ROI for Social Media Marketing.
Platform-Specific Benchmarks and Tracking Best Practices
Not all platforms are created equal. A “view” on TikTok is not the same as a “view” on YouTube. Understanding these nuances is critical for a Social Media ROI Metrics strategy.
| Platform | “View” Definition | Median Engagement Rate | Best Post Type |
|---|---|---|---|
| 3 Seconds | 3.6% | Pictures/Videos | |
| 3 Seconds (Now “Views”) | 4.3% | Reels | |
| TikTok | Starts Playing | 4.86% | Short-form Video |
| 2 Seconds | 6.5% | Carousels/PDFs | |
| X (Twitter) | 2 Seconds | 2.15% | Text/Threads |
RivalIQ’s 2025 Social Media Industry Benchmark Report shows that posting frequency is shifting. For example, X users now average only about 2.2 posts per week, a massive decline from previous years. Meanwhile, brands are finding success with Meta’s Commerce Manager Insights to track returning buyers and social commerce retention.
Organic vs. Paid Distinctions
Organic social is about community building and Connecting a Audience Tips Social Marketing. Paid social is about precision targeting and direct response. You should measure them differently. Organic success is often measured by engagement and sentiment, while paid success is almost entirely about CPC, ROAS, and conversions.
Tools for Tracking Social Media Performance Metrics
You don’t have to do this manually. There are powerful tools available to help:
- Native Analytics: Facebook’s Meta Business Suite and LinkedIn’s built-in dashboards are great starting points for smaller businesses in Castle Rock or Monument.
- Third-Party Tools: Sprout’s Report Builder guide is an excellent resource for creating custom, automated reports that you can share with stakeholders.
- UTM Parameters: Always use Bitly or a UTM builder to make sure your traffic is attributed correctly in your CRM.
- Social Listening: Tools like Talkwalker or the Hootsuite app allow you to monitor brand health and sentiment across the web.
Frequently Asked Questions about Social Media Performance Metrics
What is the difference between reach and impressions?
Reach is the number of unique people who see your content. Impressions are the total number of times your content was displayed. If you see the same ad twice, the reach is 1, but the impressions are 2. Reach is better for measuring awareness, while impressions help you understand how “loud” your brand is.
How do you calculate a “good” engagement rate for my industry?
A “good” rate varies by platform and audience size. Generally, smaller accounts have higher engagement rates. Use the medians from the table above (e.g., 4.3% for Instagram) as your baseline. If you are significantly below that, it’s time to Optimize Content for Social Media.
Why is follower count considered a vanity metric?
It’s called a vanity metric because it can be easily inflated (through bots or “follow-for-follow” schemes) without actually helping your business. A million followers who never buy anything are worth less than 500 followers who are loyal customers. However, as a growth trend, it is still a valuable indicator of brand health.
Conclusion
At Evergreen Results, we believe that social media should be more than just a digital billboard. For active lifestyle and food/beverage brands in Colorado — from the trails of Boulder to the breweries of Fort Collins — social media is a tool for community building and sustainable growth.
By moving beyond vanity and focusing on the social media performance metrics that truly matter, you can turn your social channels into a powerhouse for your brand. Whether you are Serving Up Content for Social Media Success or trying to Measure ROI in Social Media Marketing, data is only as good as the strategy behind it.
Ready to level up your social media game? Get Started with a custom dashboard or Download now a free reporting template to start tracking what matters today.