
From Clicks to Cash: Unlocking Instagram Ad ROI
Why Instagram Ads ROI Matters for Active Lifestyle Brands
Instagram ads ROI measures revenue generated against ad spend, with most brands targeting at least a 3:1 return-$3 in revenue for every $1 spent.
Key Instagram Ads ROI Benchmarks:
- Target ROAS: 3:1 minimum (4:1 for high performance)
- Average CPC: $0.40-$1.25
- Average CPM: $3-$6
- Average CPE: $0.02-$0.07
- Marketer Confidence: 68% report positive ROI
- Average Referred Sale Value: $65
For active lifestyle and food brands, Instagram’s visual nature is powerful for storytelling, but tracking real performance is complex. Platform metrics can overstate results, privacy changes limit data, and multi-touch journeys make attribution messy.
That matters because most outdoor, fitness, and better-for-you food brands aren’t just chasing likes-they’re managing cash flow, inventory, and seasonality. If your reporting makes Instagram look profitable when it’s actually being propped up by branded search or email, you risk scaling the wrong campaigns. On the flip side, if your analytics under-credit Instagram (a common GA4 issue), you may cut the exact ads that are creating future demand.
I’m Adam Bocik, founder of Evergreen Results in Denver, CO. I’ve spent over a decade helping outdoor and wellness brands scale through performance-driven campaigns. This guide walks you through measuring and maximizing your Instagram ad returns by focusing on accurate tracking, clean funnel strategy, and creative that converts.
What you’ll get from this article:
- A practical definition of what “good” ROI looks like for Instagram ads (and when ROAS is the wrong metric)
- The most common tracking pitfalls affecting e-commerce and lead-gen brands
- A measurement stack that reduces guesswork when privacy limits attribution
- Optimization ideas custom to active lifestyle and food/beverage buying behavior
Terms related to instagram ads roi:
- Social media ROI strategies
- how to calculate roi for social media marketing
- Optimize content for social media
Defining a Good Instagram Ads ROI for Your Brand
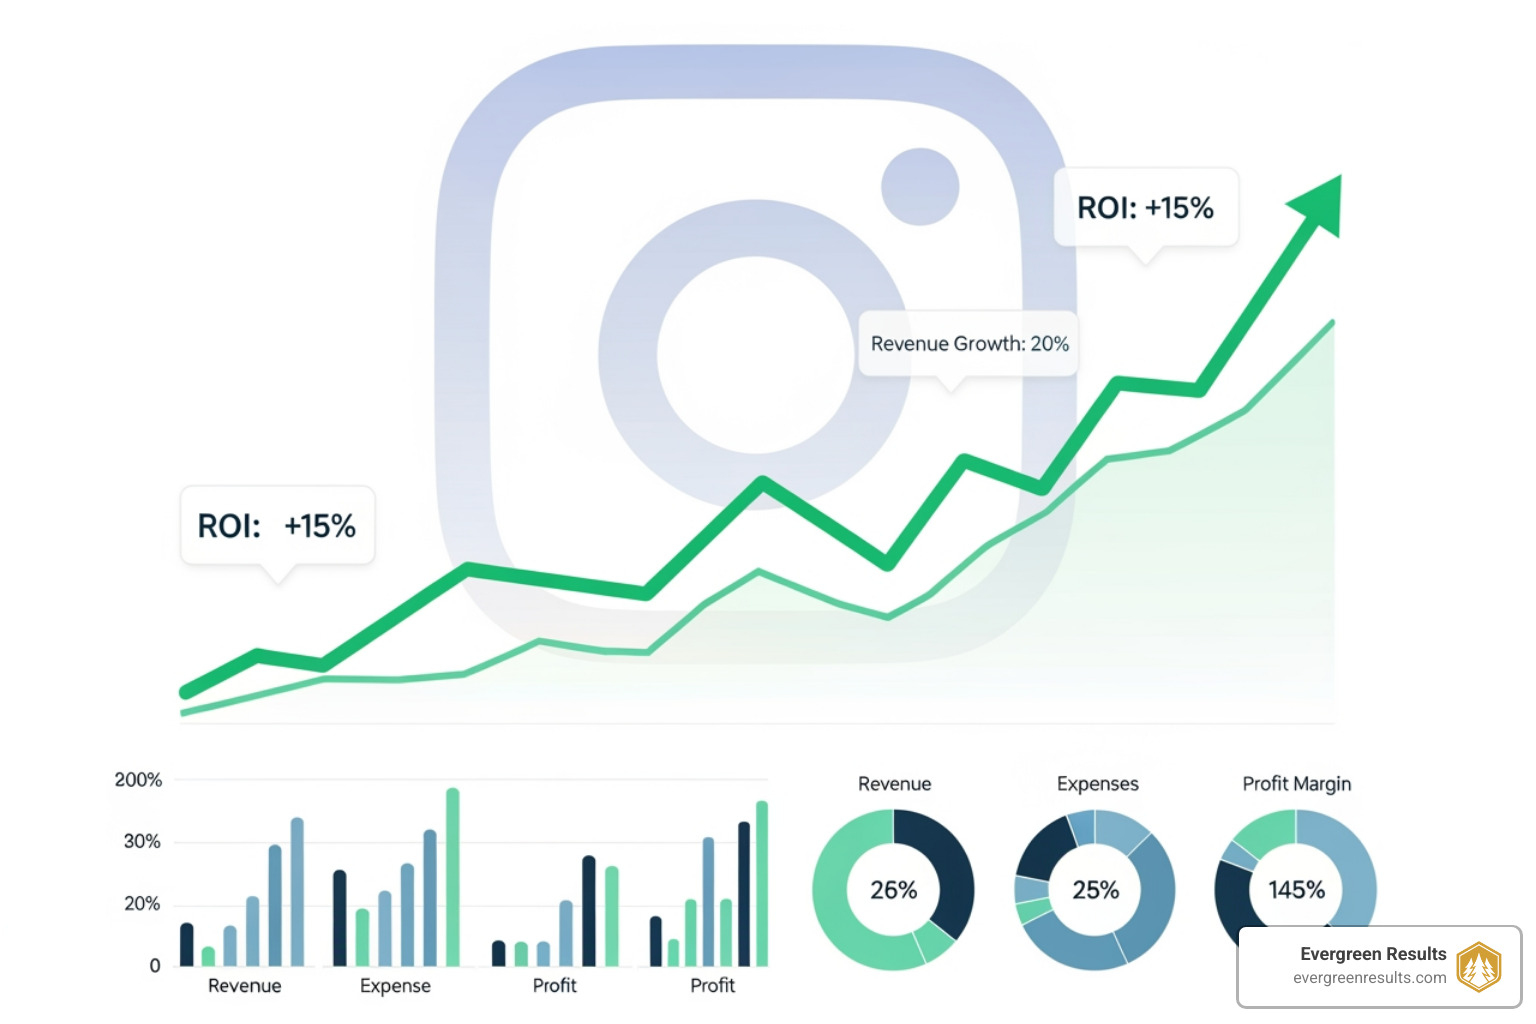
A “good” Instagram ads ROI typically targets a 3:1 ratio. For e-commerce businesses in the active lifestyle and food sectors, a 4:1 ratio is often the benchmark for strong profitability. We measure this primarily through Return on Ad Spend (ROAS): (Revenue from Ads / Cost of Ads) x 100.
That said, ROAS is only “good” if it matches your margins and your growth goals. A 3:1 ROAS can still lose money if:
- Your gross margin is thin after shipping and fulfillment
- You rely heavily on discounting to drive conversions
- Your product is low AOV and you have high payment processing or return rates
Conversely, a 2:1 ROAS can be acceptable if you’re intentionally investing in customer acquisition and you have strong repeat purchase behavior (for example, subscriptions, replenishable foods, or high retention in a loyalty program). In those situations, you should track both first-order ROAS and customer lifetime value (LTV).
Cost Per Acquisition (CPA) is another vital metric. For our clients, a CPA under $30 is generally excellent, though this varies by product price. With an annual advertising reach of over 928 million people, Instagram offers a massive pool for visual storytelling.
| Metric | Average Range |
|---|---|
| Cost-Per-Click (CPC) | $0.40 – $1.25 |
| Cost-Per-Mille (CPM) | $3.00 – $6.00 |
| Cost-Per-Engagement (CPE) | $0.02 – $0.08 |
| Cost-Per-Acquisition (CPA) | $5.00 – $75.00+ |
| Return on Ad Spend (ROAS) | 3:1 – 4:1 |
ROI vs. ROAS (and which one to report)
ROAS is a platform-friendly performance metric, but ROI is the business metric that accounts for costs beyond ad spend.
A simple way to think about it:
- ROAS answers: “Did the ads create enough revenue?”
- ROI answers: “Did the ads create enough profit after costs?”
If you’re selling a $65 average order and your landed gross margin is 55%, you have about $35.75 in gross profit before advertising and overhead. That context helps you set a realistic CPA ceiling and prevents you from scaling campaigns that look great in Ads Manager but fail in the bank account.
While 68% of marketers are confident in Instagram’s ROI, success depends on aligning metrics with specific business goals. You can explore more here: Social Media ROI Metrics.
Overcoming Challenges in Tracking Instagram Ads ROI
Measuring Instagram ads ROI is complex because standard click-based attribution often misses the full customer journey. Many users see an ad, do not click immediately, but search for the brand later.
Cross-device tracking is another hurdle. A user might see an ad on mobile but purchase on a desktop. While Meta’s Pixel and Conversions API (CAPI) help, privacy regulations and ad blockers create data gaps. Understanding these threads is essential for How to Measure ROI in Social Media Marketing.
Here are the most common reasons Instagram looks “unprofitable” (even when it is contributing):
- View-through behavior: People remember the brand and return later via direct, organic, or search.
- Longer decision cycles: Higher-priced gear, bundles, or specialty food items can require multiple touches.
- Multiple stakeholders: For some wellness and outdoor purchases, one person sees the ad and another completes the order.
- In-app friction: Users may save a post, share it, or follow the account first, then purchase days later.
And here are reasons Instagram can look “too profitable” (even when it is not):
- Retargeting bias: Heavy retargeting can inflate ROAS by mostly converting people who were going to buy anyway.
- Attribution overlap: Email, SMS, affiliates, and search may also claim the conversion.
The Impact of Privacy and Apple’s ATT
Apple’s App Tracking Transparency (ATT) framework (iOS 14.5) allows users to opt out of tracking, severely limiting Meta’s ability to attribute conversions. This leads to reduced data fidelity, shorter attribution windows, and potentially higher reported CPAs. We can no longer rely solely on platform metrics to calculate ROI for social media marketing.
Limitations of GA4
Google Analytics 4 (GA4) often uses last-click attribution, which credits the final search rather than the Instagram ad that sparked interest. GA4 also lacks impression tracking, meaning “view-through” conversions are ignored. To truly measure the success of your digital marketing, you must look beyond session-based tracking.
In practice, most growing brands need a blended approach: Meta reporting for directional optimization, GA4 for site behavior and channel mix, and a first-party tracking layer to connect sessions, leads, and revenue across devices. If you need help implementing this stack in Denver, CO, Evergreen Results supports full-funnel measurement as part of our Digital Advertising work.
Advanced Methods to Measure True Performance
To overcome privacy problems, we use first-party click tracking and impression modeling to find the true Instagram ads ROI.
First-Party Click Tracking: We implement tracking that captures touchpoints directly on our site. This allows us to connect multiple interactions to a single user, even across different sessions. Integrating this with a CRM shows which leads actually turn into revenue.
Impression Modeling: This uses analytics to attribute value to “view-through” impressions. For visual brands, seeing an ad is often enough to drive a later purchase. This recognizes the upper-funnel value of Instagram.
To make these methods actionable (not just theory), we typically set up a measurement plan that answers three questions:
- What is the conversion event that matters most?
- For e-commerce: purchase, subscription start, or first order over a threshold
- For lead generation: qualified lead, booked call, or trial start
- What time lag is normal for your buyers?
- Some products convert same-day; others need 7-30 days of repeated exposure
- What is the acceptable cost to acquire a customer given your margin and repeat rate?
When you define those up front, your reporting can focus on the metrics that actually change decisions: incremental lift, blended CAC, and contribution to pipeline-not just in-platform ROAS.
Creative quality is also paramount; Nielsen suggests creativity accounts for 56% of sales ROI. We combine high-quality visuals with a lead magnet bridge to warm up audiences.
Examples of “lead magnet bridges” that fit active lifestyle and food/beverage brands:
- A gear checklist or trail guide that captures email before pushing the sale
- A recipe pack, meal plan, or nutrition guide that pre-sells the product story
- A short quiz (fit finder, flavor finder, bundle builder) that improves match quality
These methods are critical for maximizing effective PPC and digital ads.
Strategies to Optimize and Boost Your Returns
Leveraging Visuals and Ad Formats
Instagram is visual-first. Over 72% of posts on Instagram are photos, but video and interactive formats often drive higher returns.
- Video Ads: Generate significantly more engagement; shoppers watching videos are twice as likely to purchase.
- Carousel Ads: Showcase multiple products, leading to 18% higher engagement.
- User-Generated Content (UGC): Converts at 2.3x the rate of brand-only creative.
- Influencer Marketing: Micro-influencer partnerships can yield an average ROI of 421%.
A practical way to improve performance without reinventing your entire ad account is to build a repeatable creative system:
- Hook (first 1-2 seconds): A clear outcome (more energy, better recovery, lighter pack, better flavor) rather than a brand logo
- Proof: UGC, reviews, or a quick demonstration of the product in real conditions
- Offer and CTA: One next step (shop now, build a bundle, take the quiz) instead of multiple options
Optimizing Spend and Shopping Features
- Match Objective to Funnel: Use awareness ads for cold audiences and retarget for conversions.
- Advantage+ Placements: Meta’s AI can boost ROAS by 21% by automating placements.
- Landing Page Speed: Reducing load time by one second can increase conversions by 20%. See our tips on PPC Landing Page and E-commerce.
- Instagram Shopping: Use product tags and collection ads to allow in-app purchases. By 2026, social commerce will be a primary driver for active lifestyle brands.
Additional optimization levers we commonly use for Denver-based clients (and brands selling nationally):
- Creative rotation cadence: Refresh best performers before frequency spikes and CPM rises.
- Structure for learning: Keep enough budget per ad set to exit learning and avoid constant resets.
- Offer sequencing: Test value-first messaging (education, guides, recipes) before discount-first messaging.
- Retargeting segmentation: Separate “engaged but not visited site” from “added to cart” so you can tailor the message.
Automation tools like Zapier can connect ads to your CRM for lead scoring, helping you optimize content for social media more efficiently.
Frequently Asked Questions about Instagram ROI
What is a good ROAS for Instagram?
A good ROAS is typically 3:1. For competitive e-commerce niches, we aim for 4:1. Anything below 1.5:1 usually indicates a loss once overhead is considered.
How do Instagram ad costs vary by industry?
Costs fluctuate based on competition and seasonality. Q4 often sees CPMs jump 30-50%. While average CPCs range from $0.40 to $1.25, high-competition fitness or tech niches can see much higher rates.
Are Instagram ads better than Facebook ads for ROI?
It depends on the audience. Instagram attracts a younger demographic (18-34) and excels at visual findy and impulse buys, often leading to a higher Average Order Value (AOV) for lifestyle brands. Facebook often provides lower CPCs for direct lead generation. A coordinated approach across both platforms usually yields the best overall Instagram ads ROI.
Conclusion
Maximizing Instagram ads ROI requires moving beyond surface-level metrics. By embracing first-party tracking and impression modeling, brands can capture the full value of their visual storytelling.
At Evergreen Results in Denver, CO, we specialize in helping active lifestyle and food brands steer these complexities. We focus on strategies that turn clicks into cash and build sustainable communities. Don’t let attribution gaps hold you back. Explore our insights on Serving Up Content: Social Media to start scaling your brand today.